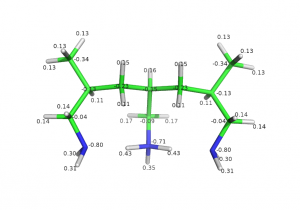
With QM software like GAMESS/Firefly it is possible to obtain much information about a molecule in text format. There exist some �envelope� software like Gabedit or WxMacMolPlt that could help you to visualize this information. Here we provide some instructions that will allow you to make your own visualization using powerful abilities of PyMol. Below you can find step-by-step instruction of how to visualize partial charges or other atomic information.
For example, let�s describe the algorithm that will draw a molecule and label every atom with its atomic charge. We assume that atomic charges were calculated using GAMESS/Firefly software and output.log is the resulting output file. Firstly we need to extract PDB structure from it:
babel -igamout output.log -opdb it.pdb
babel program is a part of very useful openbabel package (here you can find the openbabel documentation).
Next we need to extract charge information from LOG-file. Open it with text editor and find the following string:
          TOTAL MULLIKEN AND LOWDIN ATOMIC POPULATIONS
       ATOM         MULL.POP.    CHARGE          LOW.POP.     CHARGE
    1 C             6.376784   -0.376784         6.303959   -0.303959
    2 H             0.826833    0.173167         0.874629    0.125371
If you need Mulliken charge then select corresponding column in text editor (you need to use text editor that allows column selection, for example vim editor) and save it to the separate file charges.txt.
Then open your it.pdb with pymol. Use the following sequence of console commands to upload charges array to the variable �stored.a�:
import numpy stored.a = numpy.loadtxt('charges.txt')
Note that numpy python libraries should be installed into your system.
Finally, use the following command to fill atom properties (partial charges in our case) with values from the variable:
alter (all), partial_charge = stored.a[ID-1]
Then press square «L» button on the right panel and select «Other properties» -> «Partial charge». All charges will appear near all atoms!

Semi-protonated tri-allilamine was optimized in 631* basis set with DFT-B3LYP level of theory. Charges were computed with MP2 at equilibrium geometry.
by comcon1 & leela