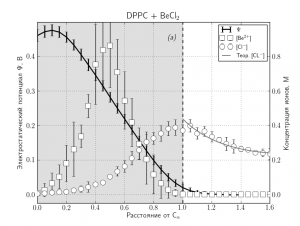
?????????? ???????????? ???????? ? matplotlib ????????? ? ????? ??????????? ??????????. ??? ????, ????? ?????? ??? ?????? ?????? ?????????? ??????????? ??????? ?????????? ??????????, ??? ?? ????? ????????, ??????? ????? ??????, ???????, ??????? ???????? ????, ??? ????? ? ?????? ??????. ? ?????? ?????? ???????? ??????????? ?????????? ?????? ???????, ?? ??????? ???????? ?? ?????? ????????? ???? ??????????? ??????.
???????? ?????? ?????????? ??????? ????????????? ???????????? ? ??????????????????? ?????????? ? ???????? DPPC ?? ??????? ????????????? ??????-???? ? ??????????? ??????????????? ???????? Be2+ [??????????, ? ??., 2011]. ???????? ???? ?????? ????????? ???????:
???????? ????????? ??? ???????? *nix (#!), ????? ????? ???? ????????? ./script.py, ?? ???????? ????????????? ?????????, ???? ????? ???????????? ??????? ?????????.
#!/usr/bin/python
# -*- coding: utf-8 -*-
??????????? ????? ?????????? ??? ?????? ? ????? numpy.
from numpy import *
from matplotlib.pyplot import *
from matplotlib.mlab import *
????????? ??? ????????? ?? ?????? ???????.
from matplotlib.lines import Line2D
????????????? ?????????? ?????? ? ?????? ?????????. ?????????? rc ????? ?????????? ? matplotlibrc-?????, ????????, ?????.
rc('font',**{'family':'sans-serif','sans-serif':['DejavuSansMono']})
??????? ????????? ???????????? ??? ?????????? ???????? ?????????:
Tcurr = 2.77
_eopt = 80.0
_k = 1.38e-16
_T = 340
_e = 4.8e-10
_Na = 6.022e+23
__cinf = +240.0  # infinite conc., mol*m^-3
__x0   = +10.0  # surface position, Ang
??? ??????? ??????? ??? ????????? ????????????? ?????? ?????? ???????????? ??????-?????????, ??? ??? ??????? ?????:
newpsi   = lambda x,eps: -2*_k*_T/_e * \
 log(cos(sqrt(2*pi*_e**2*_Na*__cinf*1.e-6/eps/_k/_T)*(x-17)*1.e-8))
newconc  = lambda x,eps: __cinf*exp(newpsi(x,eps)*_e/_k/_T)
??? ??????? ?????????????? ?????????? x ?????? ???????????? ???????? linspace(), ??????? ????? ?????????, ???????? ?????????? ? ?????????? ?????. ??? ??????????????? ????? ???? ??????????????? ??????? — logspace(). ???? ???????? ?????? ? ??????????? ???. ???????? ????? ?? ????????????.
x = linspace(10, 16, 50)
y = newconc(x,40)
print x,'\n',newpsi(x,20)

p1 = loadtxt('becl_fiii.xvg')
d1 = loadtxt('becl_gdens.xvg')

mna = 1.e3/22.989
mcl = 1.e3/35.452
na2mM = 1.e6/22.989
cl2mM = 1.e6/35.452
F = 96485.3 #C/mol
??????????, ????? ????? ????????????????? ????? ???????? ?????? ?????????? ? ????? 12 ????? ??? ?????? ??????? searchsorted() ? ??? ??????, ???? ?????? ??? ????????????. ? ?????? ?????? d1[:,0] — ??? ??????????????? ?????? X-?????????.
x_s = searchsorted(d1[:,0], 12.)
print 'Adsorbed surface charge, uC/cm2'
??? ?????????? ?????????????? ?????????? ??????? ???????? ????? ?????????? ???????? trapz(), ?????????????? ?????????????? ??????? ????????. ?? ???? ??? ???????? ??????? X ? Y ????????? ?????.
print '+',trapz(2*d1[:x_s,5]*na2mM-d1[:x_s,7]*cl2mM, d1[:x_s,0]*1.e-8)*F
?? ???????? ????????? ?? ?????? ??????????? ? ??????? figure(), ??????? ??????? ?????? ???? ? ??????? axes(), ????????? ? ???? ???? ???????????? ?????. ???? ??? ??? ??????? ??????????, ?? ??? ????? ???????? ????????????? ??? ?????? ?????? ??????? plot() ??? ?? ????????, ?? ?????????? ?? ????, ?? ????? ???????? ?????? ? ??????????????? ??????????. ????? ??? ????????????? ?????? ??? ????????? ?????????? ????.
figure()
a1 = axes()
????? ?????? ?????????????? ???????? text(), ?????? ?????????? ???????? ?? ??? ????, ? ??????? ???????? ???????. ??????????? ????? ??????? xlim() ?? ??????? ????????? ??????. ? ?????? ?????? text.usetex ?????????? True ? matplotlibrc, ??????? ????? ????? ?????? ‘\em la-la’ ? ????? ‘la-la’ ????? ??????? ????????.
text(-0.7, 0.45, u'\em ?')
??? ????????? ???????? ? �?????� ????? ???????????? ???????? errorbar(), ?????? ???? ??????? ???????? ????? ? ???????? yerr. ? ???? ??????? ???? ???????? ????????? ??? ??????????? ???????? ? ???????? ??????.
lns1 = errorbar(p1[:,0], p1[:,1], yerr=p1[:,2]*Tcurr, fmt='-k', lw=2,\
 label=u'$\\Psi$')
?????????? ???????????? ??????? ?????????? ?????????: ????????? ????????????? ?????????????? ????? ??????.
fill_between([-1,1], [0.5,0.5] , -0.025, color='#c0c0c0', alpha=0.5)
ylim(-0.025,0.5)
???????? ???????: ????????? ????? ???????????? ????? ???????? twinx(). ????? ????????? ???????? ??????? ??? �?????????? ? ??????????? ??? X�. ??? ??????????? ??????? ????? ?????????? ?? ??? ?? ??? X, ?? ??? Y ????? ??? ??????. ?? ????????? ??? ??????????? ??????.
a2 = twinx()
xlim(0, 1.6)
?? ????? ????????????? ????????? ???????????? ????? ????????, ????????? ? ?????????? ?? ??? ????????. ????????, ??? ????????? ?? ?????? ??????????? ???????????? ????? ????? ???????? ???????? axes(), ??? ??? ???????? ????. ???????, ??? ylim ????? ????????? ???, ????? ????? ????? (grid) ????? ?????????? ???????????? ???? ?? ????????? ??????????????. ?????? ??? ???????? ???????.
a2.set_ylim(-0.05,1)
a2.set_ylabel(u'???????????? ?????, ?')
??????? ?????????? ???????? ?? ????? ?? ???? ????? ????????, ???? ????????????????? ???? ???:
#a2.tick_params(axis='y', labelright=False);
???????? ????????? ?? ?????? ??????, ????? ????? ??????? ???? ????? ??????? ??? ???.
lns2 = errorbar(d1[:,0]/10., d1[:,5]*mna, yerr=d1[:,6]*mna*Tcurr, fmt='sw',\
 ecolor='black', label=u'[Be$^{2+}$]', ms=10)
lns3 = errorbar(d1[:,0]/10., d1[:,7]*mcl, yerr=d1[:,8]*mcl*Tcurr, fmt='ow',\
 ecolor='black', label=u'[Cl$^-$]', ms=10)
lnst = plot(x/10.,y/1.e3, '-', lw=1.5,color='#707070', label=u'????. [CL$^-$]')
a1.set_xlabel(u'?????????? ?? C$_\\alpha$')
a1.set_ylabel(u'?????????????????? ????????? $\\Psi$, ?')
??????? ??? Y ??? ???????? ???, ????? ??????? ?? ????? ? ?????? ???? ????????? ???? ?? ?????? ?????. ? ???? ?????? ?? ????? ???????? grid() ?? ???????? ???????????? ?????.
a1.grid()
title(u'DPPC + BeCl$_2$')
????????? ?????, ???????? ??????????????? ? ?????? ????? ?????????? ????????? artist. ?? ??????? ?????? ?????? ??? ?????? ??????????????? ???????, ? ?????? ?????? — Line2D(), ? ????????? ??? ?????? ?? ???????????? ?????:
l = Line2D([1,1],[-0.025,0.5],color='k', linestyle='--', lw=1.5)
a1.add_artist(l)
???? ??????? ??????? ???????? ??? ????? a1 ? a2, ????????? ??? ???????. ?????? ??? ????????????, ??????? ???? ???????????? ???????, ??? ?????????? ??? ??????? ? ????. ??? ??? ???? ?? ????????? ????????? ?? ??????? ???????? (plot) ? ???????? ? ??????? (errorbar). ??????? ??????? ? ???, ??? plot ?????????? ?????? ?????????? ?? ??????? ???????? ?? ?????? ????????, ? errorbar — ??? ?????????. ??????? ?? ?????????? ??? ??????? ? ?????? ??? ???:
lns = [lns1]+[lns2]+[lns3] + lnst
???????? ?????? ???????? ??? ???????:
labs = [l.get_label() for l in lns]
? ???????, ???????, ???????. ???? ?? ????? ?????? ?????? ????????? ?????? (??? ???????? ?? ?????? ???????), ?? ????? ???????????? ?????? ???? FontProperties. ??? ??? ???????? ???? ??????????? ??????????? FontProperties(). ????????? ?? ?????? ?? ???????? ? ??????? ????????? ???????:
_fp = matplotlib.font_manager.FontProperties(size=11)
a2.legend(lns, labs, loc=1, prop=_fp)
?????? ??????, ????????? ?? ????? ?? ??????????? ????????:
show()
?? ?????? ??????????? ????????? ?????? ?????? ?? ????? ?????????? [????? ?? ???????? ? ????????? ???????] ? ??????????? ??????????? ?????-?? ????????? ?????????.
