FRAP kinetics can be measured from image series directly with numpy libraries. However sometimes it is necessary to remove motion of the sample before measuring fluorescence intensity. In such a case it is possible to use normalized cross-correlation technique. Here we provide script that helps you to remove sample motion and obtain FRAP kinetics from image series with console script.Download complete archive [tar.gz]
In the archive there are fully reproducable example. You should have numpy, scipy and matplotlib libraries installed as well as PIL library. Non-standard cross-correlation calculation program for image matching is provided with code. Experimental image series in 1-channell TIFF format were put into the ./e3 folder. Try to start the command:
./difplt.py -i e3 -o output.txt
Then select the region which you should observe (the region that surrounds region of interest) and the rectangle of measure (big and small rects, correspondingly).

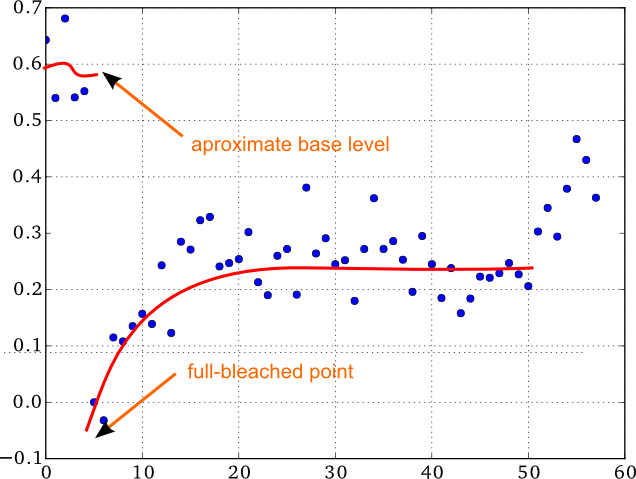
The script work such that the picture inside of big rectangle keeps its position. Therefore measuring rectangle always «measures» the same place. You can try on this series and you will obtain the following recovery curve:
This script is very simple and could not suite to your particular task. If you are going to edit script then pay attention to the following part of code:
_xcf = norm_xcorr(oribl, _im,� trim=True) mcfpos = unravel_index(_xcf.argmax(), _xcf.shape) print 'position ', mcfpos
Here oribl is a small image and _im is full image. These 2 code lines finds the position of center of small image on a big image where cross-corellation is biggest. This is a way to make «matching» of a small image on a big image in a non-strict way.